2つの式を重ねて表示するなら,
gnuplotはグラフ作成ツール. フリーウェアとして公開されている. 学術論文に使えるレベルのグラフを作成することができる. PNG, EPS, JPEG などの形式で画像を作成することができる.
シェルのコマンドラインと同じようにして,コマンドを打ち込んで図を描く. シェルのシェルスクリプトと同様に,コマンドをファイルに書いておいて,まとめて実行することもできる.
gnuplotは,かなりいろいろなことができる. gnuplotの使い方はウェブで検索したらたくさん見つかるので,必要に応じて調べるとよい.
gnuplotではシェルと同様に履歴機能を使うことができる. 似たようなコマンドを打ち込むときは,履歴機能を使うと楽ができる.
起動するには
$ gnuplot
と打つ. 正しく起動すればプロンプトが
gnuplot>
に変わる.
終了するときは
gnuplot> exit
とする. 終了したらプロンプトが
$
に戻る.
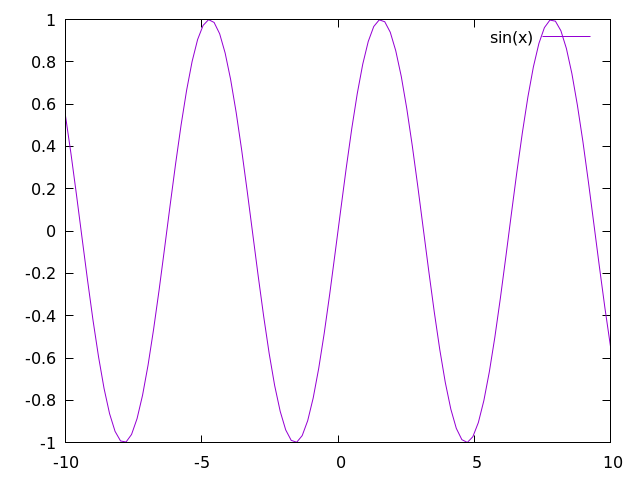
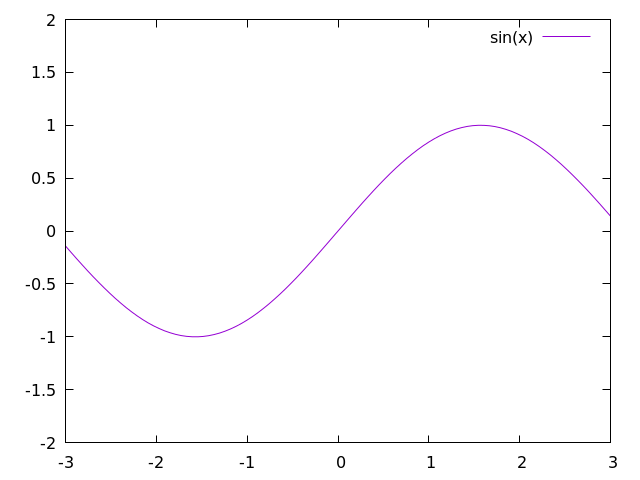
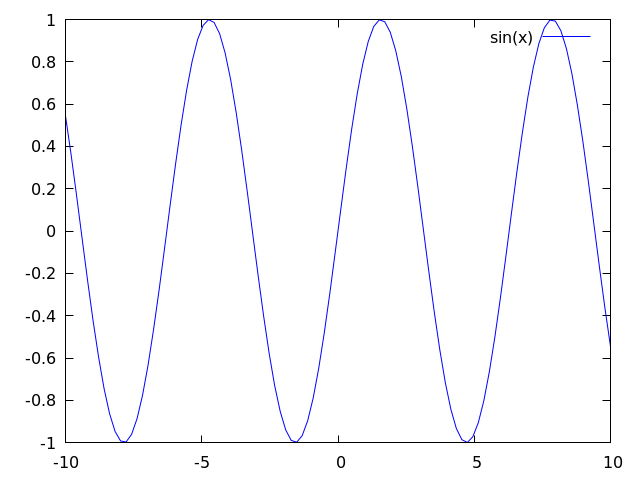
\( y = \sin (x) \)を図にしてみる.
gnuplot> plot sin(x)
新しいウインドウが開いて図が表示される(新しいウインドウが開くまで,ちょっと時間がかかるかもしれない.新しいウインドウが開くとき,ウインドウの位置を確定させるためにマウスをクリックする必要があるかもしれない).
2つの式を重ねて表示するなら,
gnuplot> plot sin(x), x
のように「,」でつなぐ.
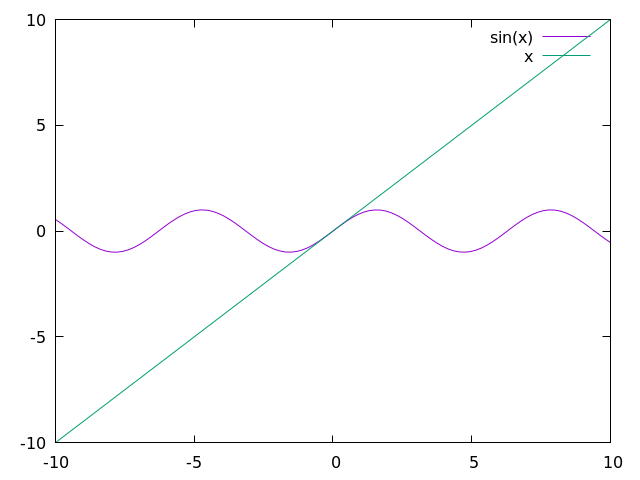
あるいは,ひとつずつ描く.
gnuplot> plot sin(x)
gnuplot> replot x
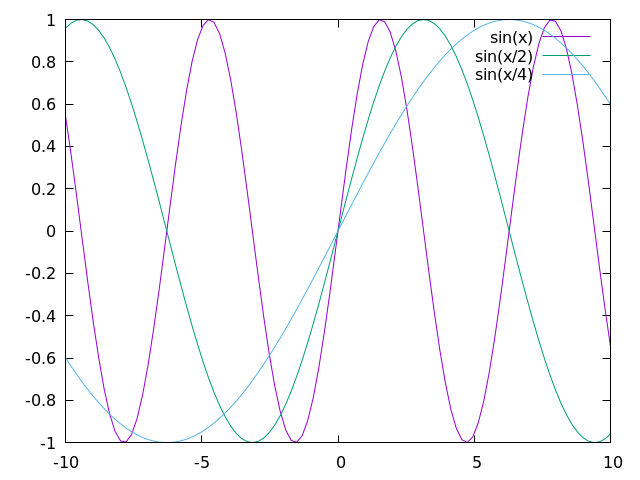
3つ以上も可
gnuplot> plot sin(x), sin(x/2), sin(x/4)
あるいは
gnuplot> plot sin(x)
gnuplot> replot sin(x/2)
gnuplot> replot sin(x/4)
割り算はちょっと気をつける
gnuplot> plot (4/2)*sin(x)
これは問題ないが,次はうまくいかない.
gnuplot> plot (2/4)*sin(x)
2/4 は整数として計算され,2/4 = 0 あまり 2 より 2/4 = 0 が代入される.
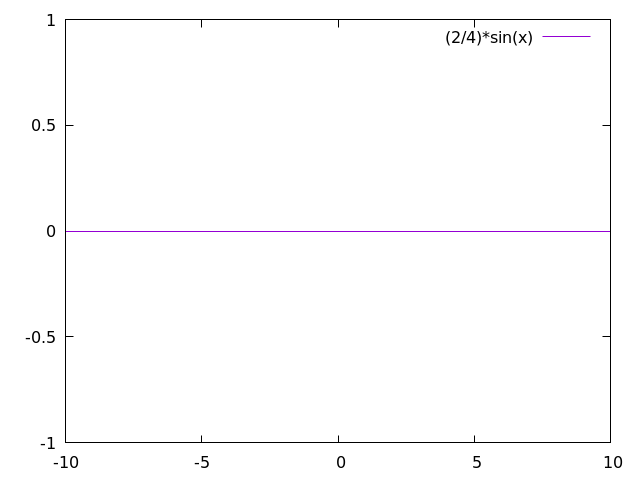
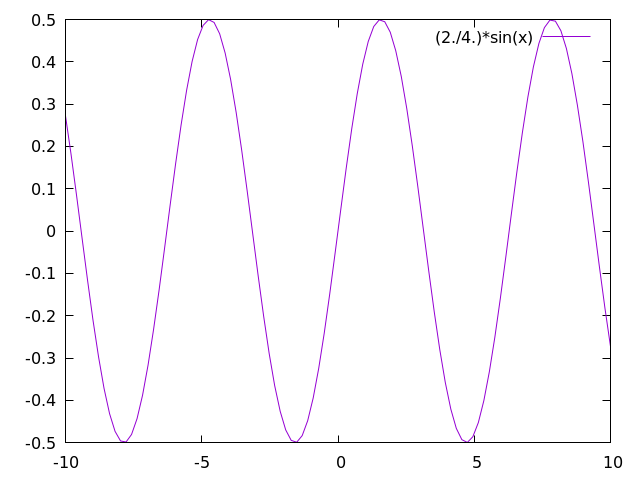
数字に小数点をつけると, 2./4. = 0.5 と計算してくれる
gnuplot> plot (2./4.)*sin(x)
式は自分で定義することもできる.
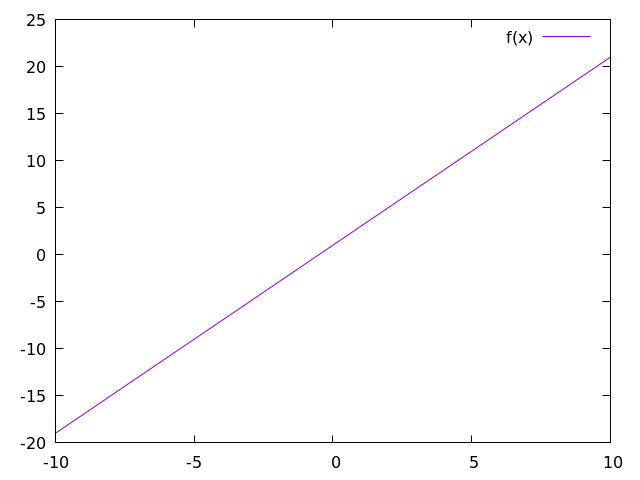
gnuplot> f(x)=2*x+1
gnuplot> plot f(x)
これで,\( 2x + 1 \) のグラフを描くことができる.
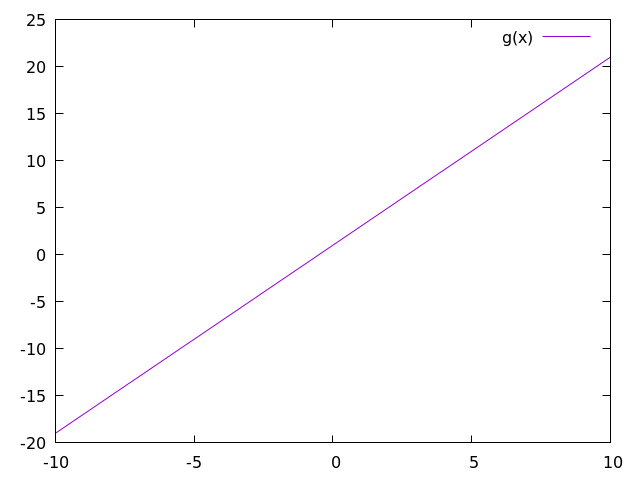
同じものを,
gnuplot> g(x)=a*x+b
gnuplot> a=2
gnuplot> b=1
gnuplot> plot g(x)
とやって,描くこともできる.
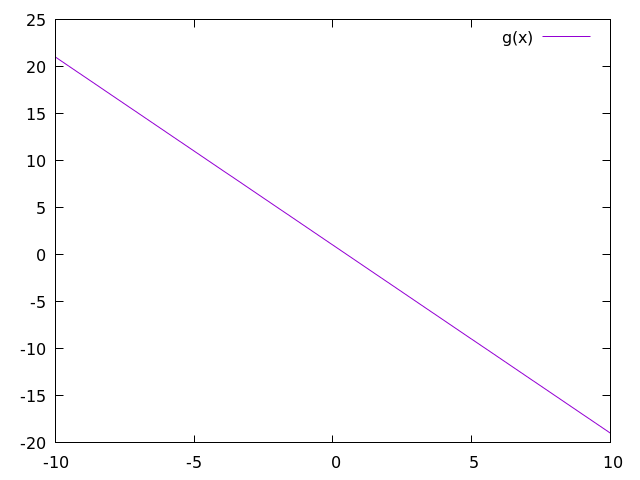
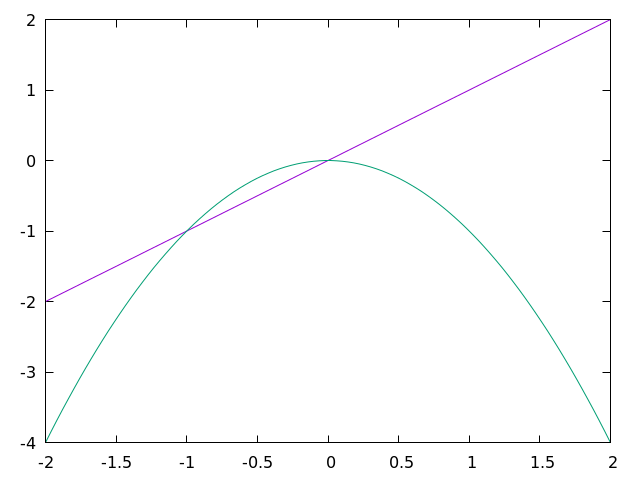
この後,a の値を変更した場合の図を描きたくなったら
gnuplot> a=-2
gnuplot> plot g(x)
としたらよい.
描画範囲を指定する
gnuplot> set xrange [-3:3]
gnuplot> set yrange [-2:2]
gnuplot> plot sin(x)
描画範囲の設定を取り消すときは
gnuplot> unset xrange
gnuplot> plot sin(x)
gnuplot> unset yrange
gnuplot> plot sin(x)
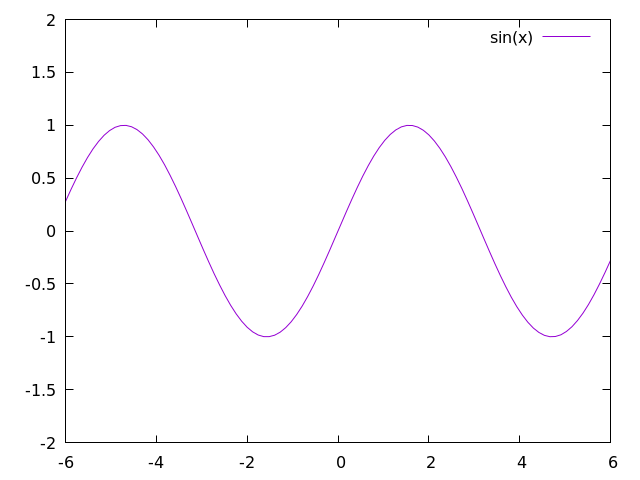
描画範囲は以下のようにして指定することも可能
gnuplot> plot [-6:6][-2:2] sin(x)
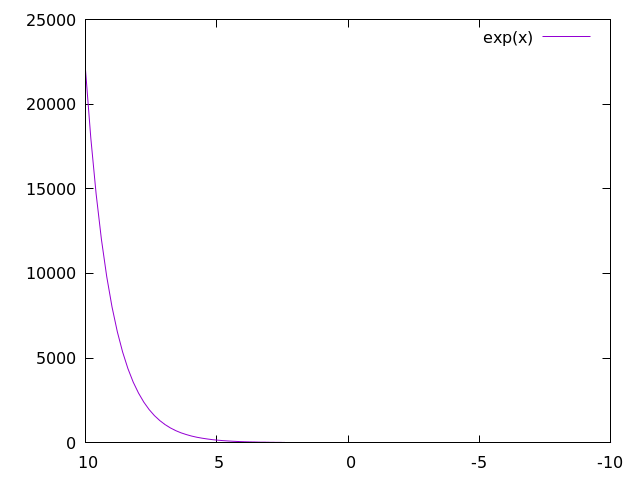
軸を反転させるとき
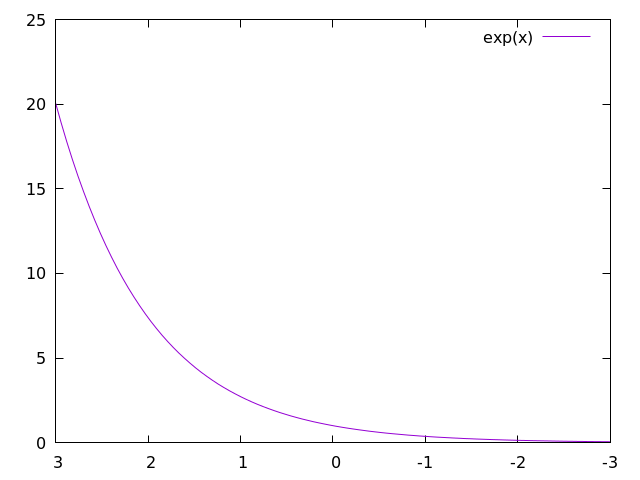
gnuplot> set xrange [] reverse
gnuplot> plot exp(x)
#exp(x) は \( e^{x} \)
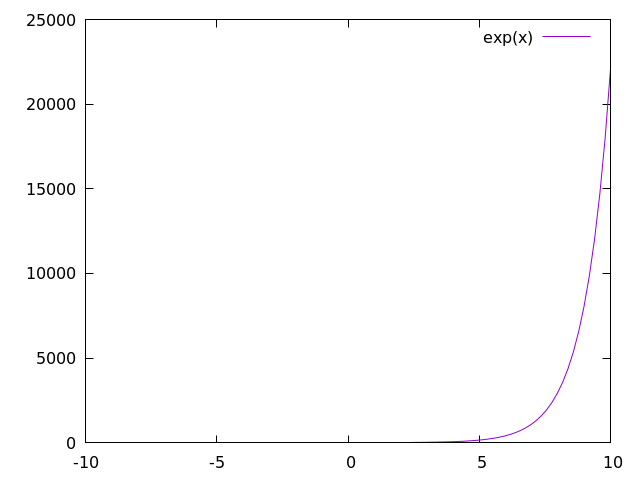
元に戻す
gnuplot> unset xrange
gnuplot> plot exp(x)
描画範囲の指定を使っても軸を反転させることができる
gnuplot> set xrange [3:-3]
gnuplot> plot exp(x)
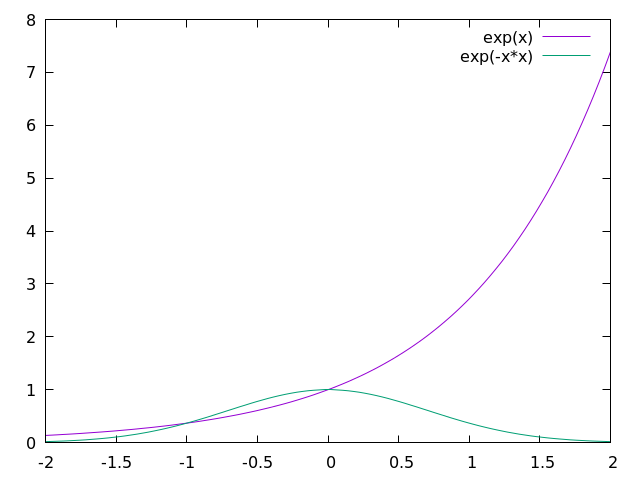
まず普通に描いてみる
gnuplot> set xrange [-2:2]
gnuplot> plot exp(x), exp(-x*x)
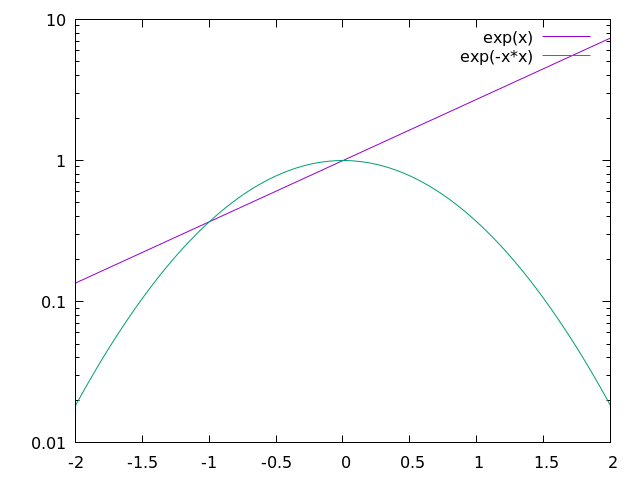
対数軸を使う
gnuplot> set logscale y
gnuplot> plot exp(x), exp(-x*x)
元に戻す
gnuplot> unset logscale
gnuplot> plot exp(x), exp(-x*x)
ちなみに,
gnuplot> unset logscale
gnuplot> plot log(exp(x)), log(exp(-x*x))
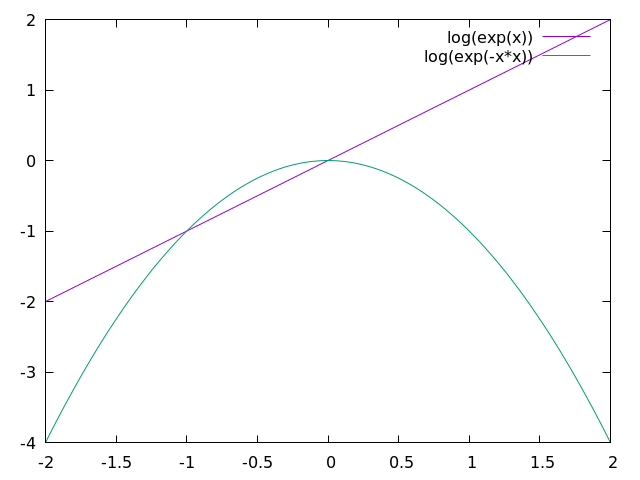
#対数軸を使うというのは,こういうこと
右上に表示される凡例を消す
gnuplot> unset key
gnuplot> plot log(exp(x)), log(exp(-x*x))
凡例を表示するなら
gnuplot> set key
gnuplot> plot log(exp(x)), log(exp(-x*x))
ファイルに書かれたデータを図にしてみる.
データは /home/atmos/ipesc/sample/gnuplot/data.txt を使う. まずデータを確認する. gnuplot を起動しているなら
gnuplot> exit
で,gnuplot を終了し,プロンプトを $ にする.
データファイルの中身を表示して,3列のデータであることを確認する.
$ cat /home/atmos/ipesc/sample/gnuplot/data.txt
-2  4  -8
-1  1  -1
 0  0   0
 1  1   1
 2  4   8
 3  9  27
2列目には1列目の値を2乗した値が,3列目には1列目の値を3乗した値が,それぞれ書かれている.
gnuplot を起動
$ gnuplot
ファイルを読み込んで図を描いてみる
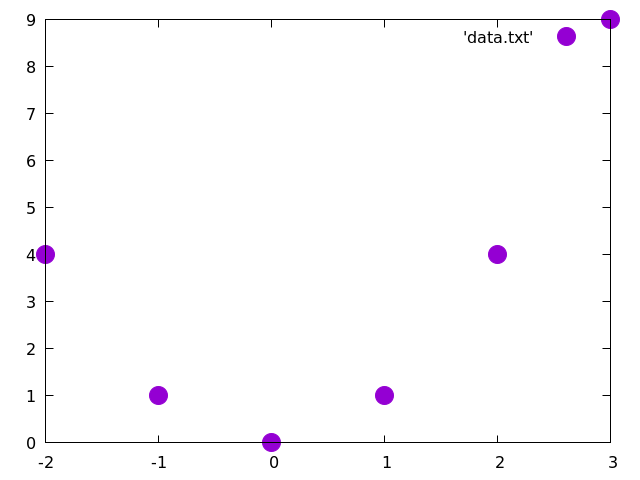
gnuplot> plot '/home/atmos/ipesc/sample/gnuplot/data.txt'
データファイルの1列目を図のx軸,2列目を図のy軸にして図が描かれる.
ちなみに,ファイル名の入力ではシェルと同様に補完機能を使うことができる.
ファイルの絶対パスをいちいち書くのは面倒だという場合は,gnuplot を終了して
gnuplot> exit
ディレクトリを移動してから gnuplot を起動して図を描く
$ cd /home/atmos/ipesc/sample/gnuplot
$ gnuplot
gnuplot> plot 'data.txt'
パスを書かなければカレントディレクトリにあるファイルを使って図が描かれる.
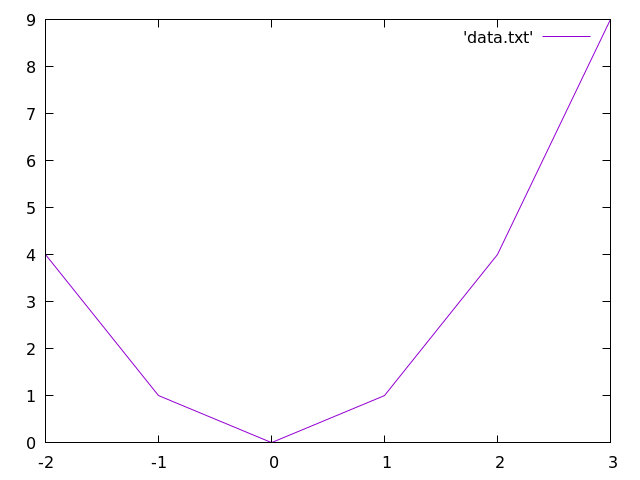
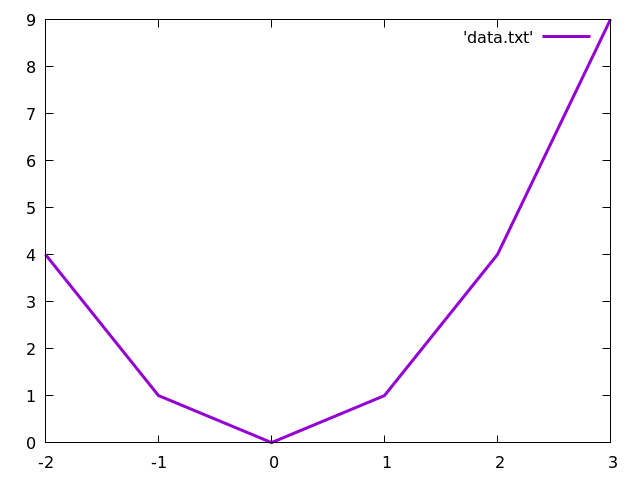
グラフを線で表示したい場合には
gnuplot> plot 'data.txt' with lines
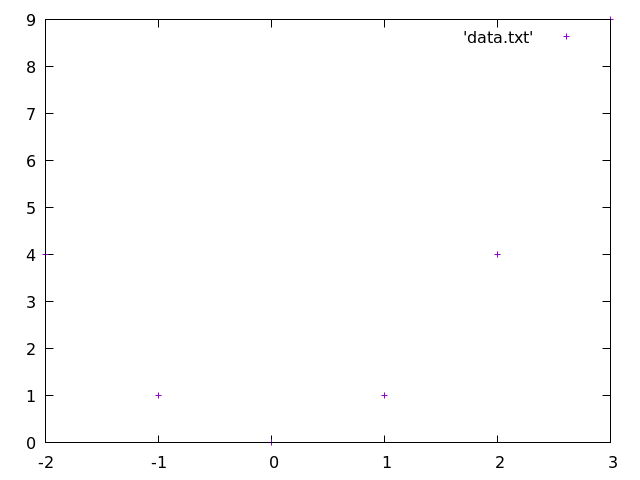
グラフを点で表示したい場合には
gnuplot> plot 'data.txt' with points
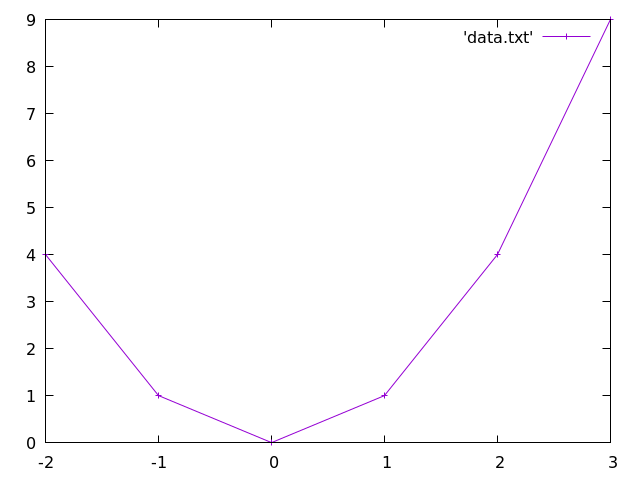
点と線の両方で表示したいときには
gnuplot> plot 'data.txt' with linespoints
点の種類を変える
gnuplot> plot 'data.txt' with points pointtype 2
gnuplot> plot 'data.txt' with points pointtype 4
gnuplot> plot 'data.txt' with points pointtype 7
点の大きさを変える
gnuplot> plot 'data.txt' with points pointtype 7 pointsize 3
線の太さを変える
gnuplot> plot 'data.txt' with lines linewidth 3
いろいろな方法があるが,とりあえず簡単な方法
gnuplot> plot sin(x) linecolor rgb 'blue'
どんな色が使えるのかは,検索したらわかるでしょう.
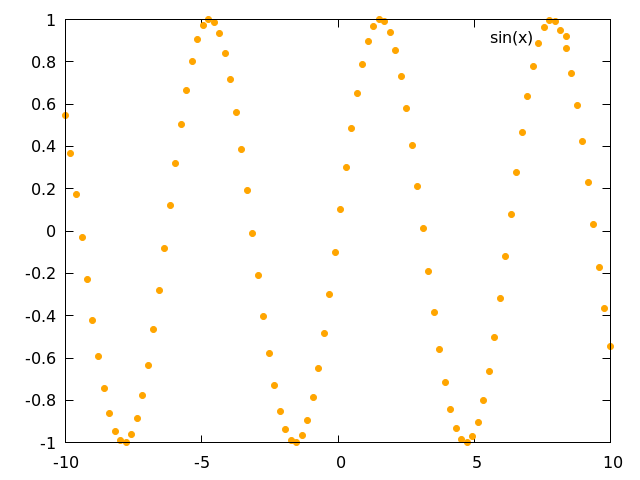
点の色も linecolor で指定する
gnuplot> plot sin(x) with points pointtype 7 linecolor rgb 'orange'
列を指定して描画するときは,using を使う. 例えば,1列目をx軸,3列目をy軸にするときは,
gnuplot> plot 'data.txt' using 1:3 with linespoints
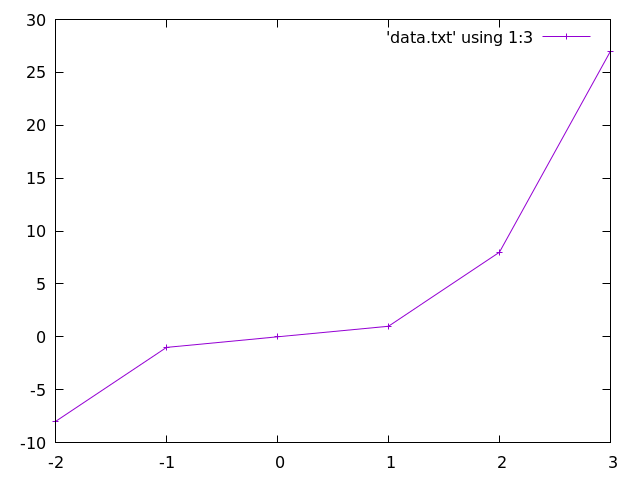
3列目は1列目の値を3乗したものであるから,using 1:3 で描かれた点は \( x^3 \) の線の上に載っているはずである. データは点で表示することにして,\( x^3 \) を重ねて描いてみる
gnuplot> plot 'data.txt' using 1:3 pointsize 3, x*x*x
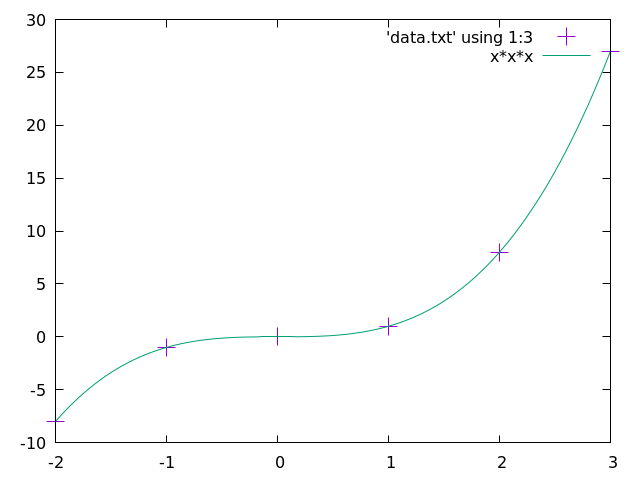
冪乗は ** を使って書くこともできる.
gnuplot> plot 'data.txt' using 1:3 pointsize 3, x**3
3列目をx軸,2列目をy軸にするなら,
gnuplot> plot 'data.txt' using 3:2 pointsize 3
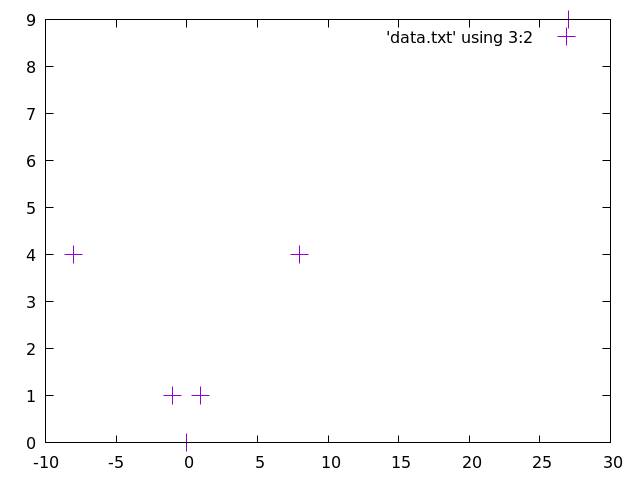
これは \( x^{2/3} \) の線の上に乗る.
確かめる
gnuplot> plot 'data.txt' using 3:2 pointsize 3, x**(2./3.)
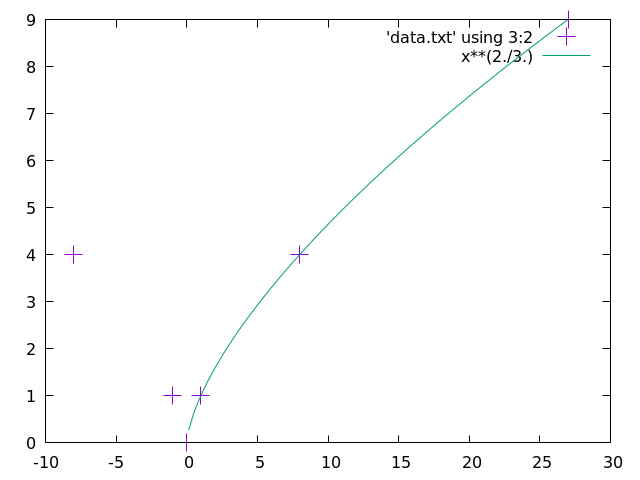
# \( x^{2/3} \) は \( x<0 \) で定義されないので,\( x>0 \) の範囲のみ描画される
using は0列目を指定することもできて,0列目を指定すると行番号が使われる.
gnuplot> plot 'data.txt' using 0:1 pointtype 7
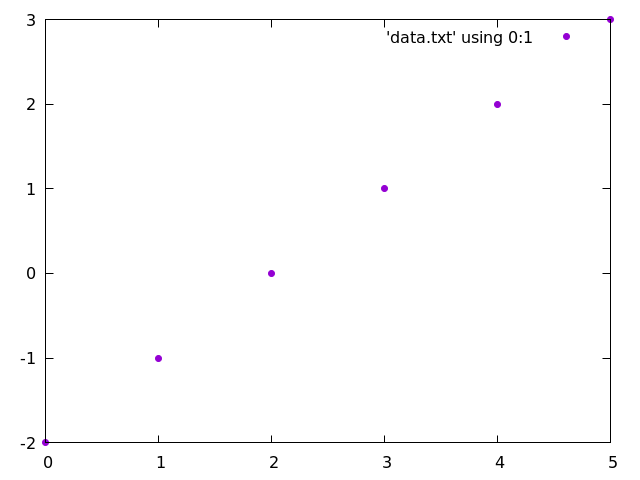
行番号は0から始まる.
すなわち,1行目は0,2行目は1,...
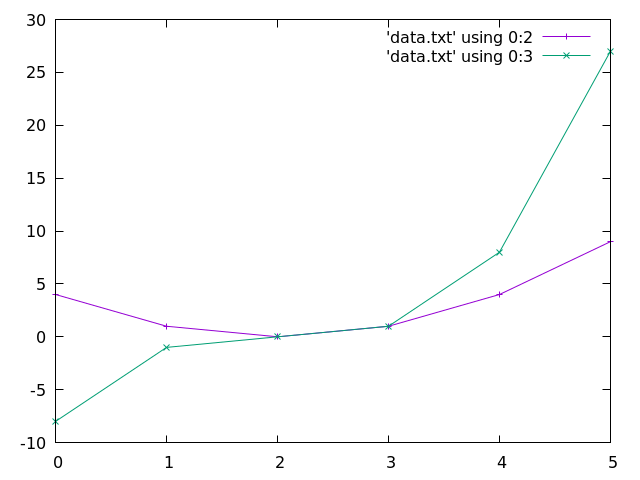
2列目と3列目を表示するなら
gnuplot> plot 'data.txt' using 0:2 with linespoints, 'data.txt' using 0:3 with linespoints
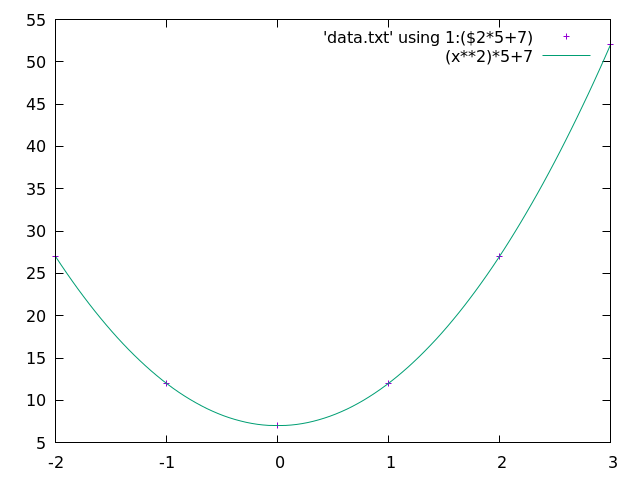
2列目の値を 5 倍して +7 する
gnuplot> plot 'data.txt' using 1:($2*5+7)
gnuplot> plot 'data.txt' using 1:($2*5+7), (x**2)*5+7
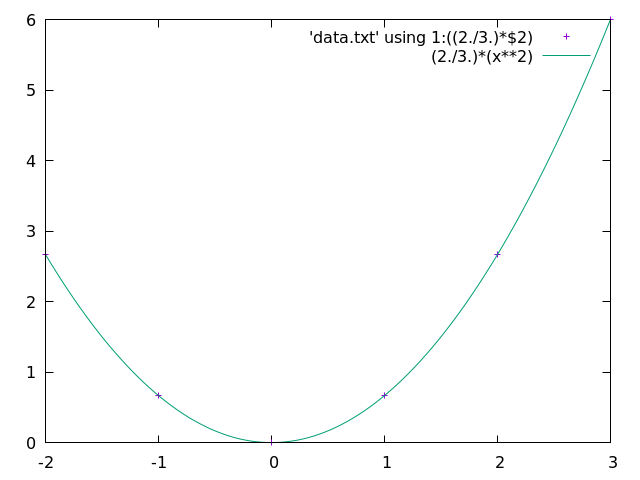
割り算は注意
gnuplot> plot 'data.txt' using 1:((2/3)*$2)
gnuplot> plot 'data.txt' using 1:((2./3.)*$2)
gnuplot> plot 'data.txt' using 1:((2./3.)*$2), (2./3.)*(x**2)
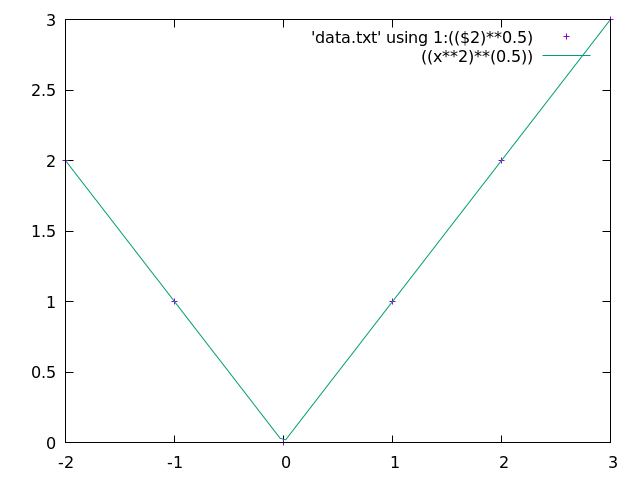
2列目の平方根(0.5乗)
gnuplot> plot 'data.txt' using 1:(($2)**0.5)
gnuplot> plot 'data.txt' using 1:(($2)**0.5), ((x**2)**(0.5))
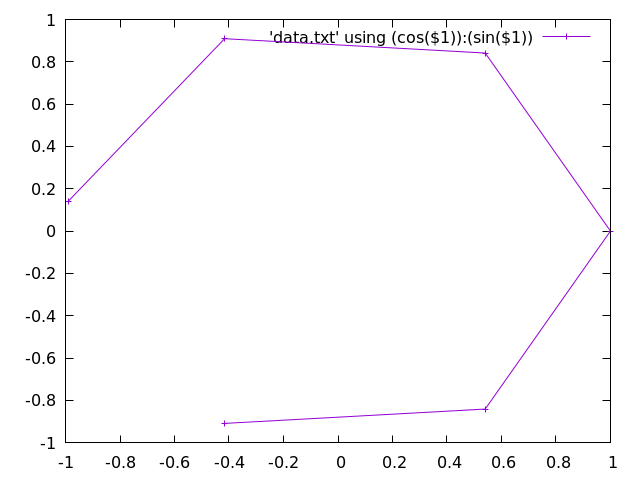
横は 1 列目の cosine,縦は 1 列目の sine
gnuplot> plot 'data.txt' using (cos($1)):(sin($1)) with linespoints
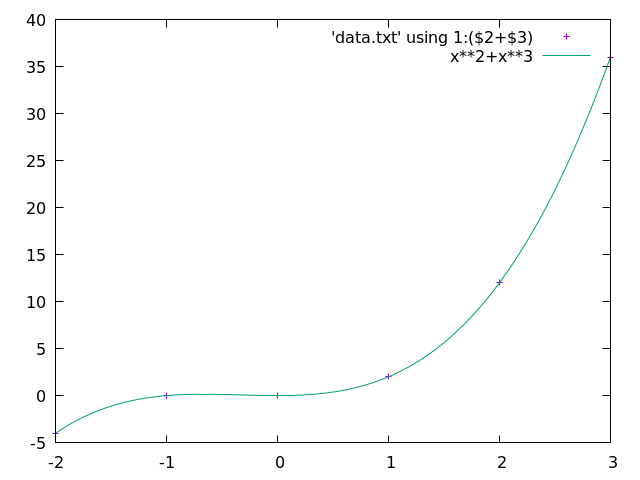
複数の列を混ぜることも
gnuplot> plot 'data.txt' using 1:2, x**2
gnuplot> plot 'data.txt' using 1:3, x**3
gnuplot> plot 'data.txt' using 1:($2+$3), x**2+x**3
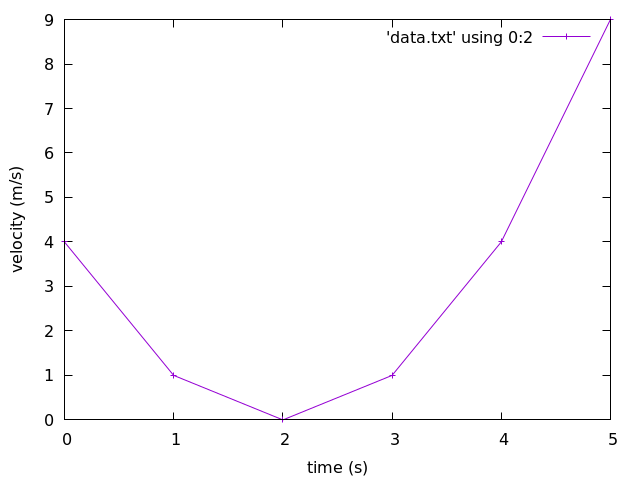
x軸やy軸にラベルをつける
gnuplot> set xlabel 'time (s)'
gnuplot> set ylabel 'velocity (m/s)'
gnuplot> plot 'data.txt' using 0:2 with linespoints
gnuplot は,区切り文字を指定しないとき,「ひと続きの空白」を区切りにしてデータを解釈する. すなわち,
1 2 3 4   6 7 8
1   2     3
          1 2 3
  1   2   3
この4行からなるデータは,4行とも1列目が 1,2列目が 2,3列目が 3,となる.
データの区切りを表す文字を指定することもできる. 「,」が区切り文字になっているデータを使うなら,
set datafile separator ','
とする.
正方形にするとき
gnuplot> set size square
縦を横の0.5倍にする
gnuplot> set size ratio 0.5